I promised a deeper dive into my stats, so let’s get to it. This is going to be a long one, folks. You’ve been warned.
As part of my day job, I work with performance measures intended to help gauge progress toward goals. When it comes to my writing, I sometimes like to appease that analyst side of my brain. Not every writer should necessarily monitor the same things. The key is to identify 1) what matters most to you, 2) what trackable data could help you monitor those specific priorities, and 3) how you can set up your tracking such that you’ll keep your data consistent and up-to-date. It won’t be of much use to you if you aren’t willing to maintain it.
Last year I took a break from my usual strategy SWOT analysis, more out of laziness than anything else. I haven’t decided yet if I’ll do one for this year. I still did plenty of tracking, though. Since I enjoy working with stats, I’ve set up several things I need to update each time I, for example, have a new story or poem published: my website, my submissions and publications tracker, my CV, etc. I get a little dopamine hit from the process, so I try to treat it as a way of drawing out the celebration of a win. (This isn’t the case for everyone, hence my 3 points above.)
I also update my key performance indicators, or KPIs. I’ve set up that file to span from the year of my first fiction sale, but before I share this latest update, I want to emphasize that my KPIs shared below don’t include the 8 years of submissions and rejections leading up to my first sale. I have all the backup data for those years, but it would make the table longer and show a bunch of zeroes; things really got interesting once I started getting stuff published. But trust me, there were years of sluggish productivity and learning the ropes and getting form rejection after form rejection. I also want to note, these KPIs focus solely on fiction, no poetry or nonfiction. Please bear that in mind. I might change that in the future.
So, how did 2024 stack up for my fiction?
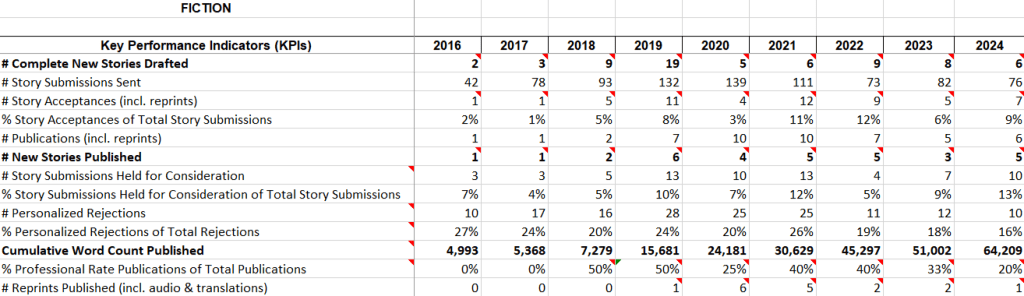
The rows in bold show my highest priorities. I want to generate new work, and I want to get more of it out into the world. Some of the other rows help me focus on the quality of that work; although I’ve noticed my “% Personalized Rejections of Total Rejections” has been trending down, my “% Story Submissions Held for Consideration of Total Story Submissions” has trended up. My “% Story Acceptances of Total Story Submissions” has been a little all over the place; as far as the count of submissions themselves, I’ve been slacking a bit in recent years and should probably make that a focus this year. The “% Professional Rate Publications of Total Publications” metric is a relic from when I was striving to qualify for SFWA membership (I became an associate member in 2020 and a full member in 2022).
I’m not the flashiest analyst when it comes to data visualization, but I do graph my priority KPIs. I chose bar graphs where I want to compare each year and make sure I’m keeping some healthy pressure on myself, and I used a line graph for the cumulative word count so that I can watch how the slope changes over time and perhaps gauge when I might be ready to pursue a collection. Plus, word count can vary so much, if I used bars for that one they might be too lumpy to show me anything useful.
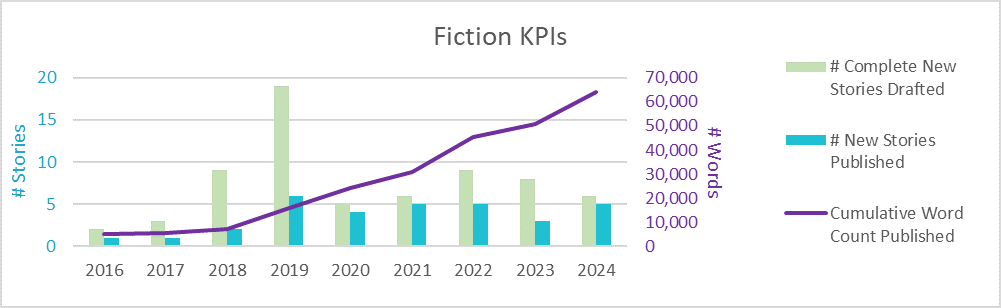
So, Katherine, what’s up with that green bar?
In 2016 I started grad school, while working full-time, with two young children. Then I finished getting my MBA in 2018, got a windfall of free time back, and had a ton of pent-up creativity start flowing out of me—hence the rising bar. Then 2019, what a year! I had so much momentum coming out of grad school. I’d trained my adult self to make my evenings more productive. Then came 2020…and COVID. My day job got eliminated, I had to do the whole job search thing after quite a few years, and I also started bringing poetry back into my creative life in a big way after having focused on short stories since undergrad. So, the recent years reflect a more equalizing out of my pace. Also, some of my newest story drafts have trended longer than in prior years. Whether it’s flash or a novelette, they each count as one.
That’s just one example of how data can tell a story. And stories can generate data. You get the gist.

2 thoughts on “My annual writing metrics—KPIs table, a bar and line graph, and some context”
Comments are closed.